Browse

Log in / Register
 Share

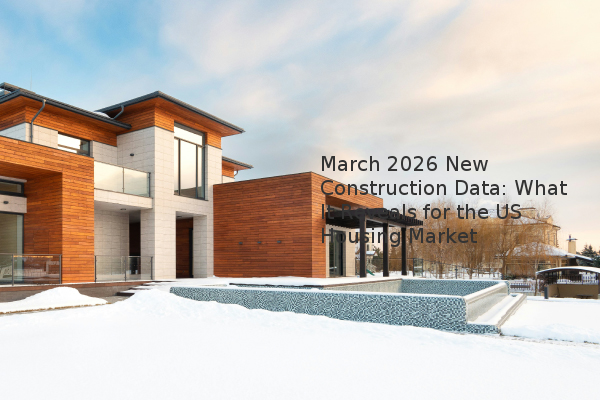
New residential construction data provides a critical pulse check on the US housing market. In March 2026, the market presents a mixed picture: while building permits saw a slight increase, housing starts and completions declined. This activity underscores a strategic shift by builders responding to ongoing economic pressures, including material costs. The key takeaway is that the national housing shortage continues to fuel demand for completed units, even as new project initiations slow, particularly in the multifamily sector. This dynamic has significant implications for homebuyers, sellers, and investors navigating the current landscape.
The most recent data shows a 1.6% month-over-month increase in building permits, which is the authorization to begin construction. This suggests that some builders are still planning for future projects. However, housing starts—the point at which construction actually begins—fell by 11.4%. This divergence indicates that builders are proceeding with caution. The primary reason for this hesitation is the increased cost of construction inputs like lumber and steel. Based on our experience assessment, obtaining a permit is a preliminary step, but breaking ground is a stronger commitment that builders are delaying until there is more economic certainty. This gap between planning and action can lead to a tighter supply of new homes in the coming months.
A clear split has emerged between single-family and multifamily construction. Multifamily projects (buildings with multiple separate housing units, like apartment complexes) saw higher permit and start activity, indicating builders are anticipating future rental demand. Conversely, single-family home completions grew by 0.9% month-over-month, while multifamily completions fell significantly. This suggests that builders are prioritizing finishing and delivering standalone homes to market. The logic is straightforward: there is immense pent-up demand from families seeking to buy homes, making single-family units a safer, quicker return on investment in the current climate. This trend is a direct response to the well-documented shortage of nearly 4 million homes in the US.
The growth in new construction is not evenly distributed across the United States. The South continues to dominate, accounting for approximately 56% of all permitted units. However, the most dramatic growth is occurring in the Northeast. Single-family home permitting in the Northeast surged by 12.9% month-over-month. This regional shift is likely driven by market dynamics; with higher home prices and less inventory in the Northeast, new construction can be more profitable for builders. Meanwhile, the Midwest showed an unexpected boom in multifamily completions, bucking the national trend. This regional analysis is crucial for anyone considering a purchase, as market conditions and new inventory levels vary dramatically from one state to another.
For homebuyers, the decline in housing starts means that the selection of brand-new homes may not increase as rapidly as hoped, potentially sustaining higher price points for new construction. Buyers may find more opportunities in the single-family completed home market as builders focus on delivering these units. For sellers of existing homes, continued low inventory overall minimizes competition from new construction, supporting their property's value. However, all parties should be aware of property tax implications; new construction can alter assessed values in a neighborhood, which can impact future tax bills. Property tax is a recurring annual fee levied by local governments on landowners, based on the assessed value of the property.
| Region | Single-Family Permits (MoM Change) | Multifamily Completions (MoM Change) |
|---|---|---|
| Northeast | +12.9% | Data Not Specified |
| South | +3.0% | -8.2% |
| Midwest | +12.4% (Completions) | +69.9% |
In conclusion, the March 2026 construction data highlights a market in transition. Builders are cautiously navigating economic headwinds by focusing on completing single-family homes where demand is strongest. For market participants, this means: