Browse

Log in / Register
 Share

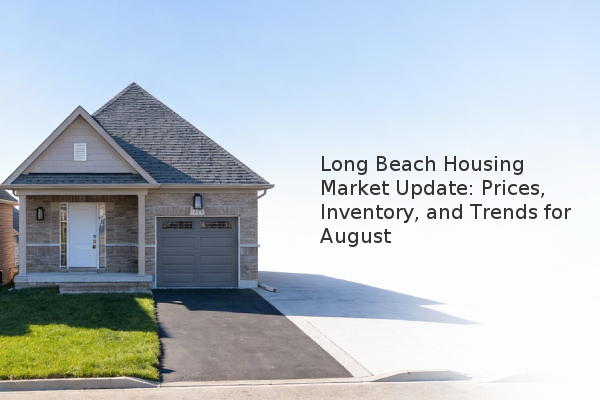
The Long Beach, California housing market showed clear signs of cooling in August, with homes taking longer to sell despite a modest increase in the median listing price to $778,000. Key metrics indicate a shift towards a more balanced market, characterized by a slower-than-typical seasonal increase in inventory and a significant lengthening of the average time on market compared to last year. For buyers, this may signal increased negotiating power, while sellers should prepare for longer marketing periods and adjust pricing strategies accordingly based on recent comparable sales, or "comps."
While the median listing price saw a slight monthly increase, reaching $778,000, the price per square foot experienced a marginal decline of 0.1%. This nuanced picture suggests that the mix of homes on the market may be changing, with potentially larger homes listed for sale. Compared to the national market, where the price per square foot fell 1.2%, Long Beach demonstrated relative price stability. This resilience is noteworthy for both buyers and sellers assessing the market's strength. The following table summarizes the recent price history:
| Month | Median Listing Price | Price per Sq Ft Trend |
|---|---|---|
| July 2025 | $772,000 | - |
| August 2025 | $778,000 | Decreased 0.1% |
| National Context | $429,990 | Decreased 1.2% |
The supply of homes for sale in Long Beach increased by 1.8% month-over-month to 569 active listings. However, this growth was smaller than what is historically normal for this season. More significantly, active inventory was up 22.1% compared to August of the previous year, providing buyers with more options. Conversely, the number of new listings coming onto the market dipped by 2.2% from July to 264, which was also 9.6% lower than the same time last year. This dynamic of rising total inventory but falling new listings indicates that homes are not selling as quickly as they were, leading to a cumulative buildup of available properties.
The average time on market (TOM) is a critical indicator of market pace. In August, homes in Long Beach spent an average of 60 days on the market before going under contract. This was eight days longer than the previous month and a substantial 14 days longer than in August 2024. This slowdown aligns with the national average, which also stood at 60 days. The increased TOM suggests that buyer demand is becoming more measured, and sellers can no longer expect multiple offers shortly after listing. Properties may require more aggressive pricing or enhanced marketing to attract buyers in this changing environment.
Based on our experience assessment, the August data points to a market in transition. For prospective buyers, the increased inventory and longer selling times can translate into less competition and more opportunities for negotiation, particularly on homes that have been listed for several weeks. It is an opportune time to conduct thorough due diligence, including a professional home inspection and reviewing recent sale prices in your desired neighborhood.
For sellers, realistic pricing from the outset is more critical than ever. Overpricing a home in a slowing market can lead to it becoming stale, ultimately necessitating a price reduction. Working with a real estate agent who can provide a data-driven comparative market analysis (CMA) is essential to position your home competitively. Highlighting your property's unique features and ensuring it is in show-ready condition can help it stand out in a market that is becoming less frantic.
The Long Beach market is normalizing, offering distinct advantages and challenges for both buyers and sellers. Success hinges on understanding these current trends and adapting strategies accordingly.